For those who are interested in summaries or averages of specific sensor measures per behavioral Event, DataView offers the script-based command under Scripting - Data Processing > Compute statistical values based on Event Codes.
Note: All scripts can be adjusted to your need with the DLX Script Editor available in DataView.
Based on the values covered by your coded Events, DataView can calculate the following statistics per Event, for any of your channels:
oSum
oMean
oStandard Deviation
oVariance
The computed values are entered as Codes in new, automatically created Events.
Perform Calculations
Independent of how the Event information was created (based on observations within INTERACT or automatically created from within DataView - based on measured values), DataView offers a script that groups all values per Event and performs the calculations mentioned. The results are written into new INTERACT Events as well as into the raw Data.
•Make sure INTERACT is running on the same computer as your copy of DataView is.
If you want to add the resulting Events into an existing document:
•Make sure you have opened the correct INTERACT file.
•Switch back to DataView.
•Select Scripting - Data Processing > Compute statistical values based on Event Codes from the DataView window.
The following dialog appears:

Computation options
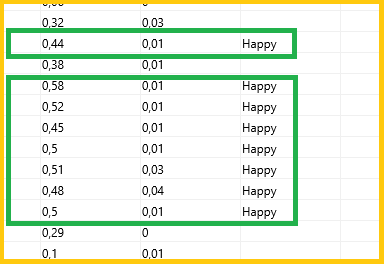
All calculations are performed on the number of lines for which a gap-less range of Codes exists, like grouped within the green borders:

oSum - Summarizes all values per grouping of the selected Code.
oMean - Computes the average per grouping of the selected Code by dividing the summary by the number of lines.
oVariance - Computes the variance of the values per grouping of the selected Code
oStandard Deviation - Computes the uncorrected empirical standard deviation per grouping of the selected Code
Chanel Selection
This area allows you to select the channels for which you want to calculate specific values.
•Use CTRL + SHIFT for selecting multiple channels.
Class and Code Selection
This area lists all Codes and Classes available in the raw data table of your sensor data.
Note: You can create those entries either values-based, with the help of the script described in Create INTERACT Events, or based on your video observations from within INTERACT, using the command Copy Codes to DataView.
Extend Raw Data
Per default, the computed results are just entered into the INTERACT Events. If you want to add those results into your raw data as well:
oSelect the option Add computed values to raw data and the bottom of the dialog.
Now all computed values will be added in additional columns of your raw data for all lines that belong to an Event.
Results in INTERACT
The routine creates new Events that cover the exact time frame as your behavioral Events and hold all calculations you selected as Codes:

Sorting this data by time, shows that you end up with multiple Event lines that cover the exact same time frame:

Once you are finished with your computations, you can easily consolidate all entries - merging all Events with identical time information:
•Select Transform - Events - Consolidate Events ![]() to consolidate the available information to a more compact view:
to consolidate the available information to a more compact view:

Now each Event holds its corresponding values.