To organize your sensor data values, you can create one or multiple layouts, to make sure you can see best what is most important to you.
Per layout, you can specify:
othe number of charts
othe height of the charts in pixel
othe combination of channels grouped per chart
othe number of columns in which the charts are displayed
othe order of the graphs over the columns
othe time frame covered by the visible data
owhether or not to show the time axis
Layout Editor
All layout related functions can be accessed in the Layout Editor:
•Choose Layouts - Edit Layouts from the menu, to open the layout editor.
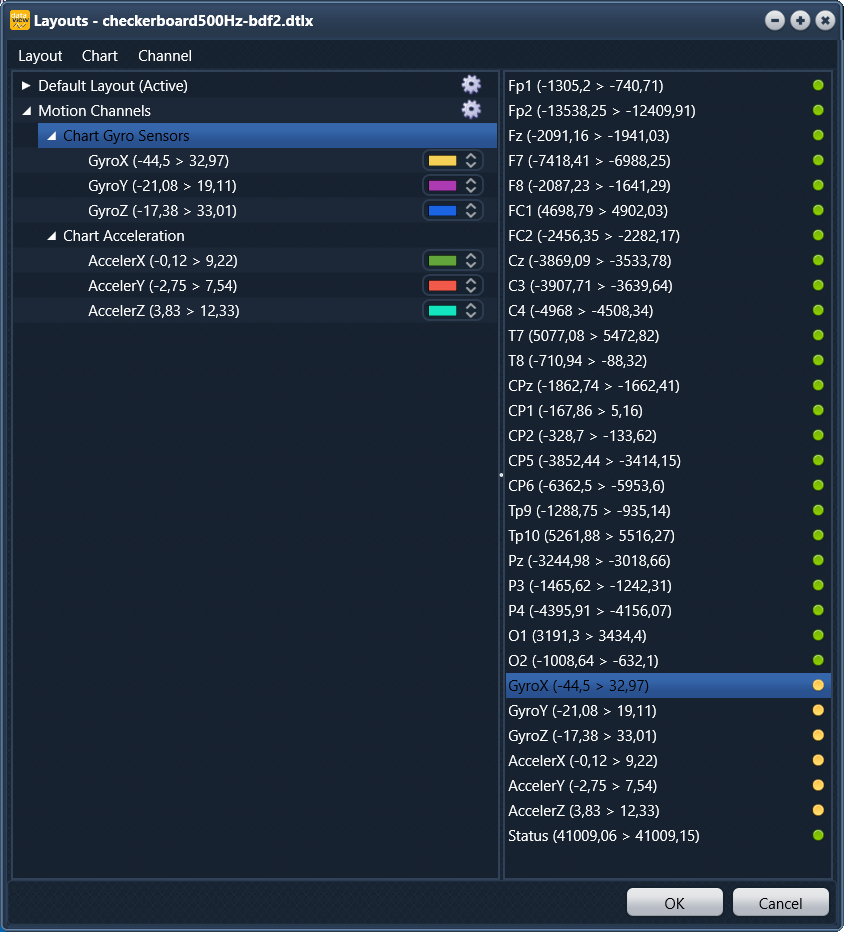
The layout editor looks like this:

The layout editor provides the following information:
oThe layout 'Motion Channels' is currently active.
oValues that are not assigned to the selected layout, show a green bullet at the far right.
oValues that are already used in the selected layout have a yellow bullet.
oLayout specific settings can be altered using the little gear icon behind the layout name.
Create New Layout
You can edit the 'Default Layout', but you can also create one or more personal layouts:
•Choose Layout - New to create a new, empty layout.
•Select the 'New Layout' entry in the left pane.
•Press F2 to rename your <New Layout> and confirm with OK.
| TIP: | If you need a layout that is similar to one existing layout, select the original layout and choose Layout - Duplicate. |
Add a Chart
Within each chart you can combine any number of channels in your preferred order.
To add a chart to your layout:
•Right click your 'New Layout' and select New chart to create the number of different charts you want to use.
OR
•Within the right pane, select the first channel you want to display in this layout.
•Drag the selected channel on top of your 'New Layout'.
This creates a new chart that contains the value you dragged.
Group Channels
To display multiple channel values into a single chart:
•Drag any of the required values from the right pane on top of the target chart name in the left pane.
•Select the chart name and press F2 to rename the chart.
| TIP: | Pay attention to the value ranges! Make sure to combine only channels with similar ranges to keep the scale alike and your chart readable. |
Order Channels
You can re-arrange the order in which channels are displayed in the legend of a multi-channel graph:
•In the Layout-Editor, drag & drop a channel name on-top of the position you want it to appear.
Rename Channels
If you imported sensor data without header information, the channels are just numbered. If you want more expressive names for your channels for easier identification, you can rename the channels accordingly:
•Select a channel in the right pane.
•Press F2 and enter the new name.
•Press RETURN to confirm the changes.
Pick Channel Color
The color-picker box that pops-up the moment you click the colored box behind a channel name, allows you to assign your preferred color to each channel:

|
Color number |
|
Color Space Slider |
|
Color picker |
|
Color box |
|
Transparency slider |
•Click on the colored box behind the channel name to open the color picker dialog.
The current color is displayed in the Color Box (![]() ). To change the color to your liking:
). To change the color to your liking:
•Select the color space with the Color Space Slider (![]() ).
).
•Drag the Color Picker (![]() ) to the position that matches the color you want.
) to the position that matches the color you want.
•To change the transparency of that channel line, drag the Transparency Slider (![]() ) to the left.
) to the left.
Order Graphs
You can re-arrange the oder of your charts for any of your layouts:
•In the Layout-Editor, unfold a specific Layout to show all charts contained.
•Select a chart and drag it on top of the chart name that is located on the position you want the selected chart to appear.
IMPORTANT: Once you have made any changes to the layout(s), you need to save your file as a *.dtlx file in order to save those changes!